Many or all of the products featured here are from our partners who compensate us. This may influence which products we write about and where and how the product appears on a page. However, this does not influence our evaluations.
The average household credit card debt in America is $9,654, and the states with the largest amount of credit card debt are Alaska, Hawaii, and New Jersey.
Between the first quarters of 2022 and 2023, The Federal Reserve Bank of New York reported that the credit card debt in America rose by $145 billion. As of June 2023, we saw a 12-month inflation increase of 3%, the smallest year-over-year increase since March 2021.
By understanding American credit card debt statistics, you’ll better understand where you stand and what you can do to potentially lower your debt. Credit card debt increases your credit utilization ratio, which can hurt your credit and ultimately cost you more money in interest.
We surveyed over 1,100 Americans to learn more about credit card debt statistics in the United States. This data covers the average debt by state, average interest rates, and more. While many of the statistics from our other sources look at the situation as a whole, our data helps us see what’s happening on an individual level.
- Despite the national average of Americans having over $9,000 in credit card debt per household, only 14% say they’re “very worried” about their debt.
- 67% of respondents said they have less than $2,000 in debt, which may indicate that only a concentrated number of people have high amounts of credit card debt.
- 20% of respondents don’t know how long they’ve been in debt.
- The majority of respondents (56%) say their credit card debt is due to unexpected expenses.
- 74% of respondents said at least one collection agency has contacted them about a past due debt.
In this article, we’ll also provide tips on how to get out of debt and work toward better credit.
Table of contents:
- Key Credit Card Debt Statistics
- Average Credit Card Debt by State
- Average Credit Card Debt by Age
- Average Credit Card Debt by Income
- Average Household Credit Card Debt
- Average Credit Card Debt by Race or Ethnicity
- Credit Card Delinquency Rates in America
- How to Get Out of Credit Card Debt and Improve Your Credit
Key Credit Card Debt Statistics
Many factors play into credit card debt, such as the average interest rates, which cards have the best offers, and the balance people carry on their card. These statistics will help you compare your own credit card balance to the national average and see if you’re getting a good deal with your current cards.
Here are the standout findings of various debt statistics:
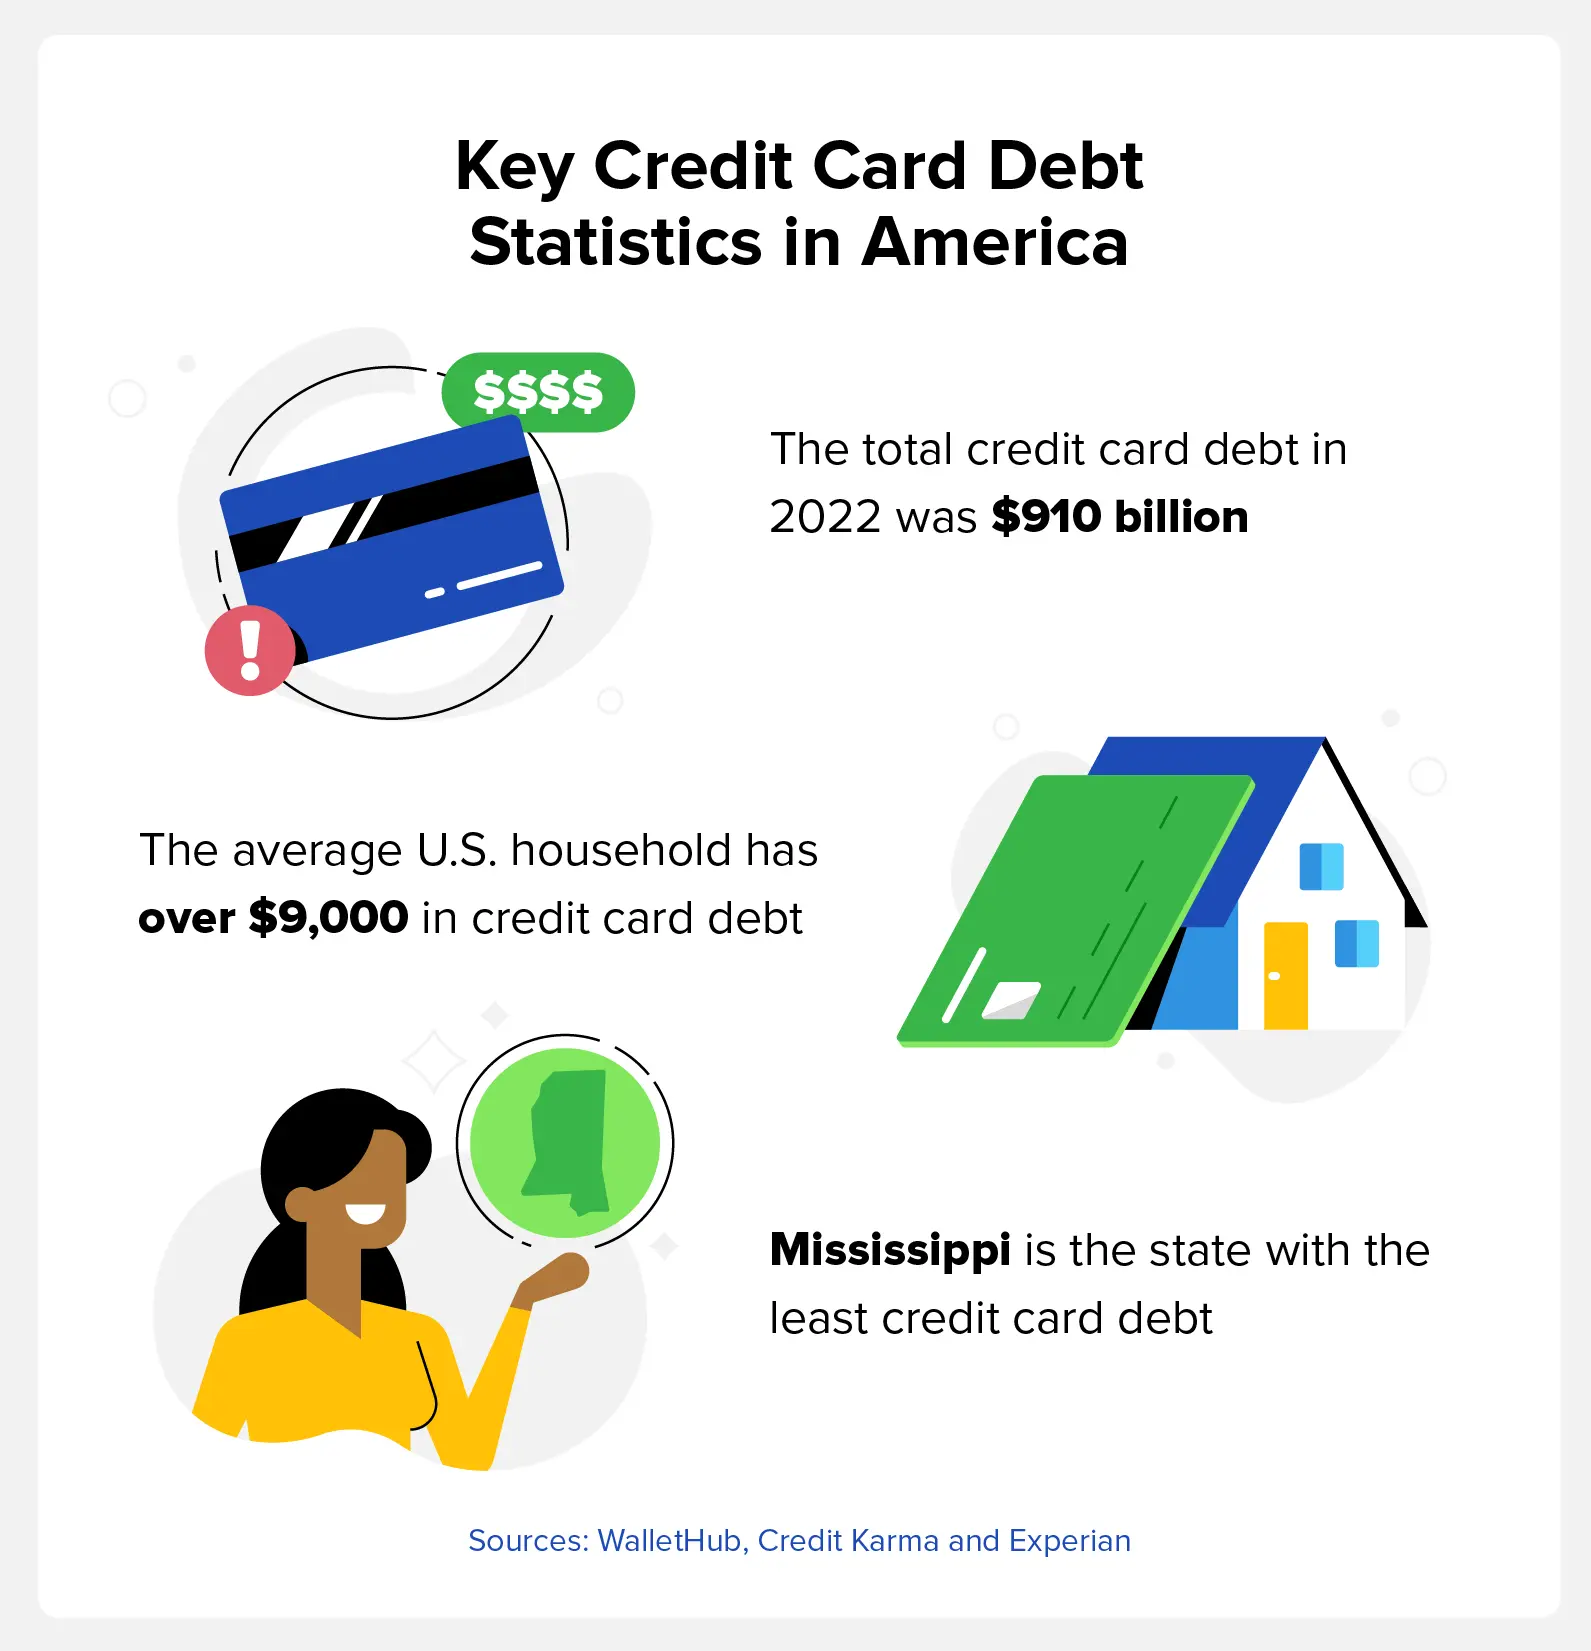
- The average American household has over $9,000 in credit card debt. (WalletHub)
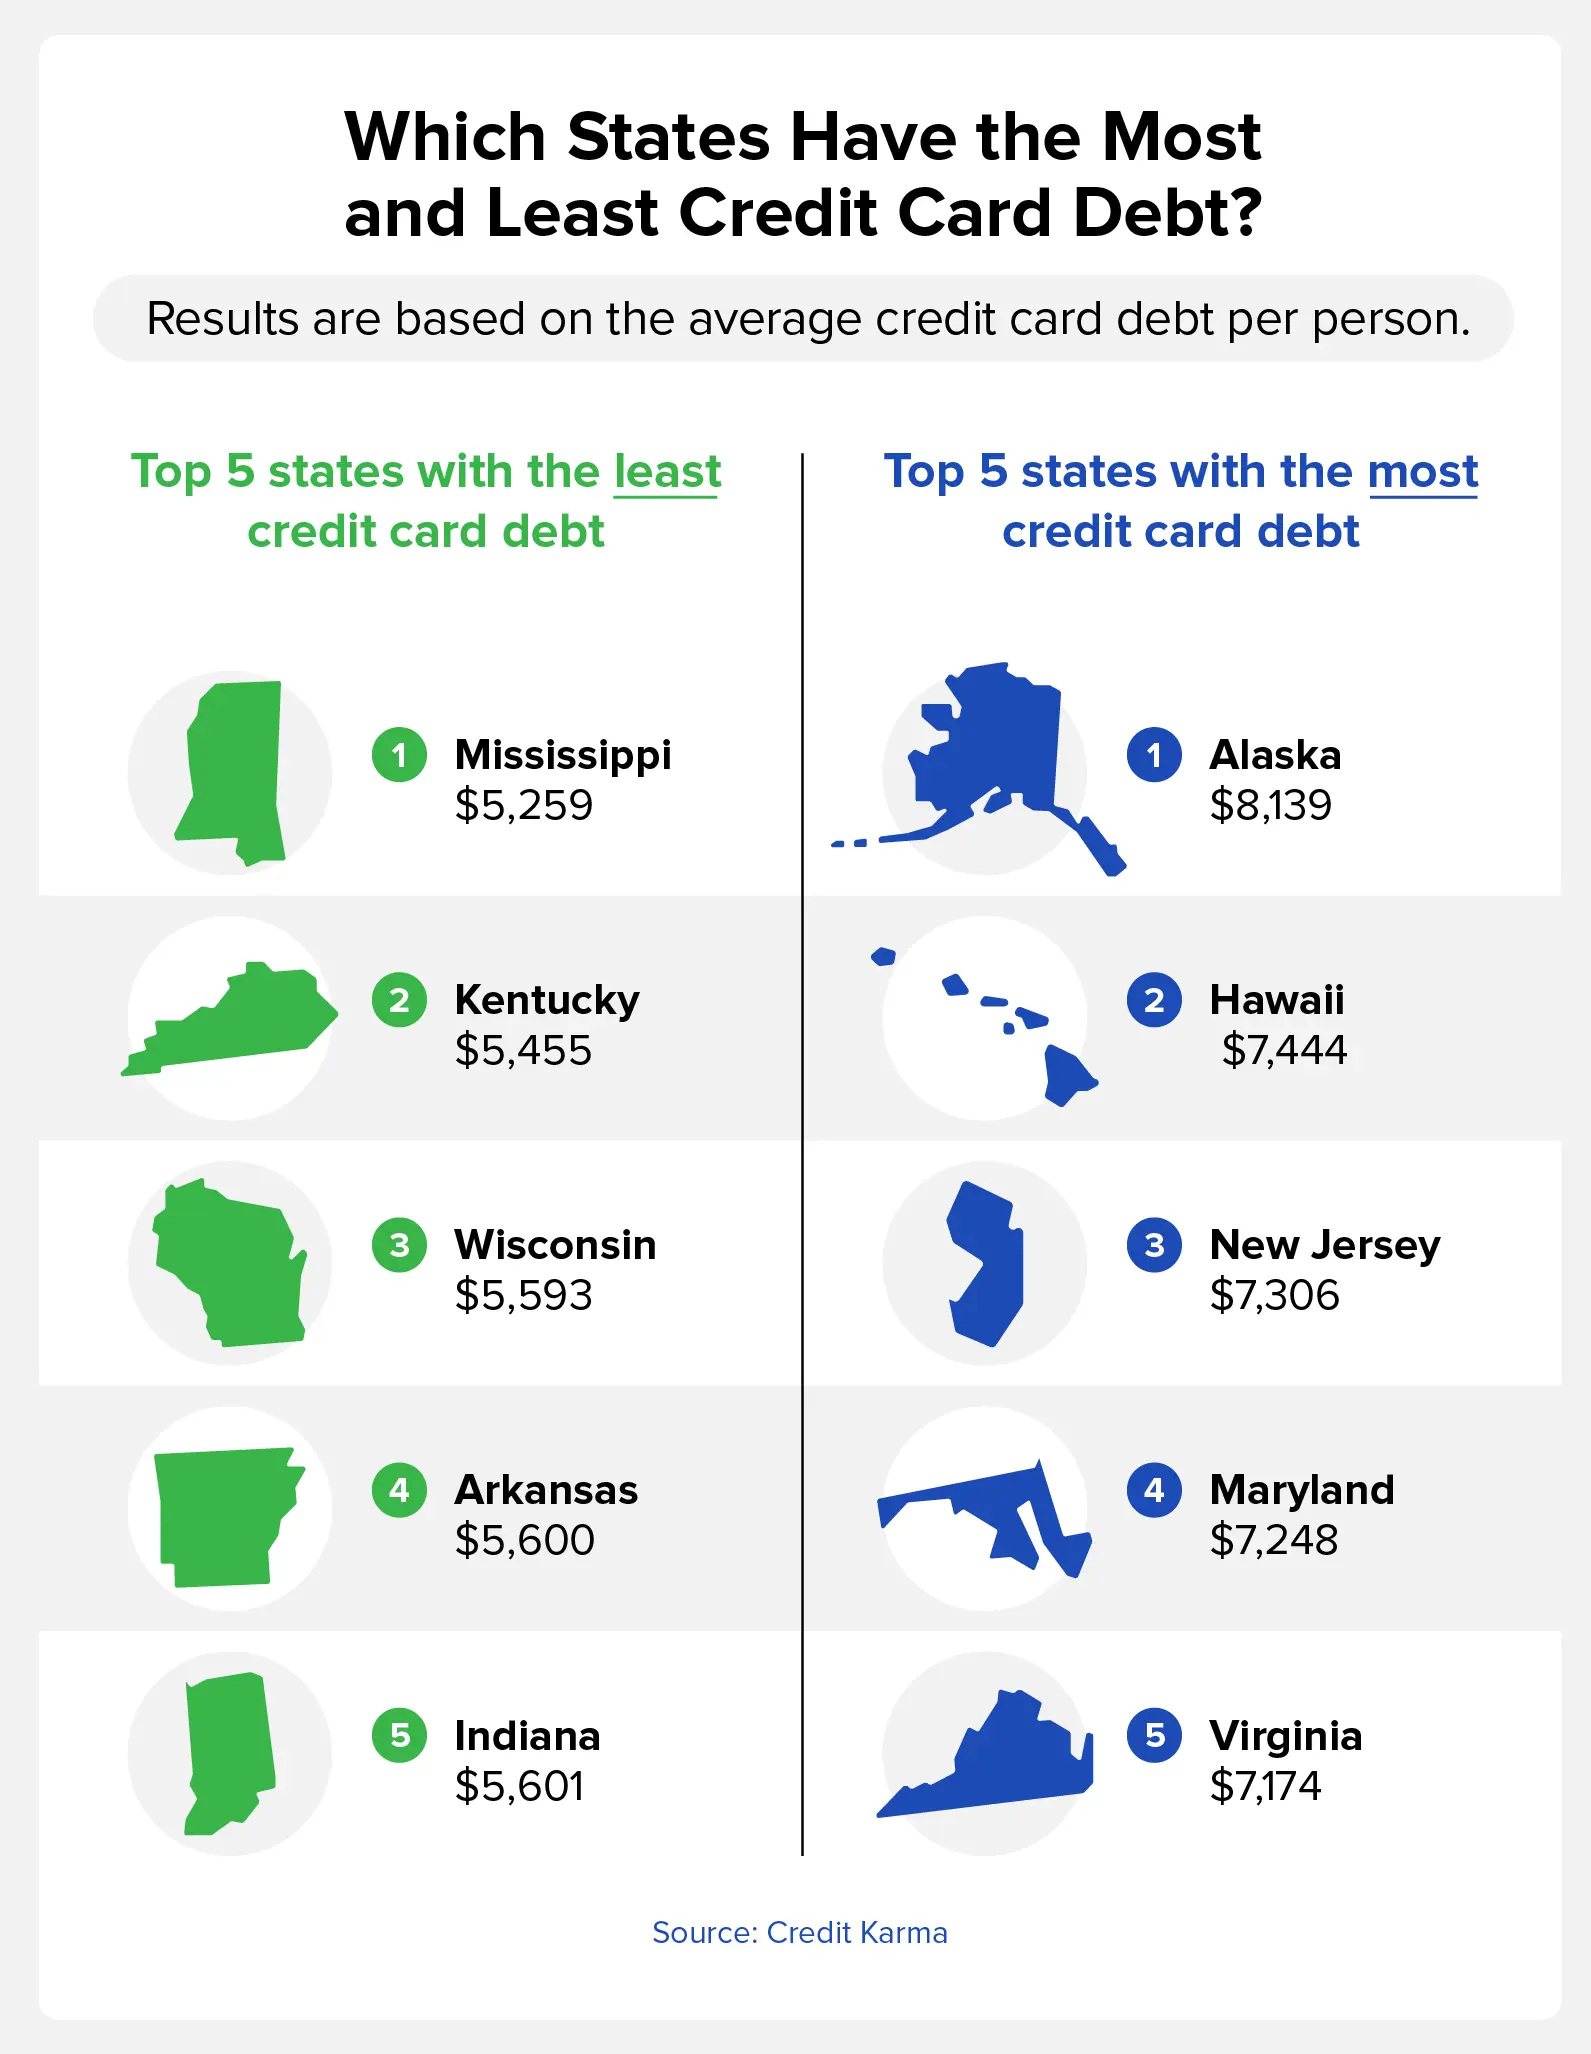
- Mississippi has the least credit card debt at $5,259 per person. (Credit Karma)
- Alaska has the most credit card debt on average at $8,139. (Credit Karma)
- Credit cards 90 days or more past due rose to 4.57% in 2023. (FRBNY)
- Individuals making $184,000 or more per year have the most credit card debt at an average of $12,600. (Federal Reserve)
- The total credit card debt in America as of Q3 2022 was $910 billion. (Experian®)

How Many Credit Cards Carry a Balance
The American Bankers Association releases a quarterly report for consumer credit conditions, and the most recent data comes from the third quarter of 2022.
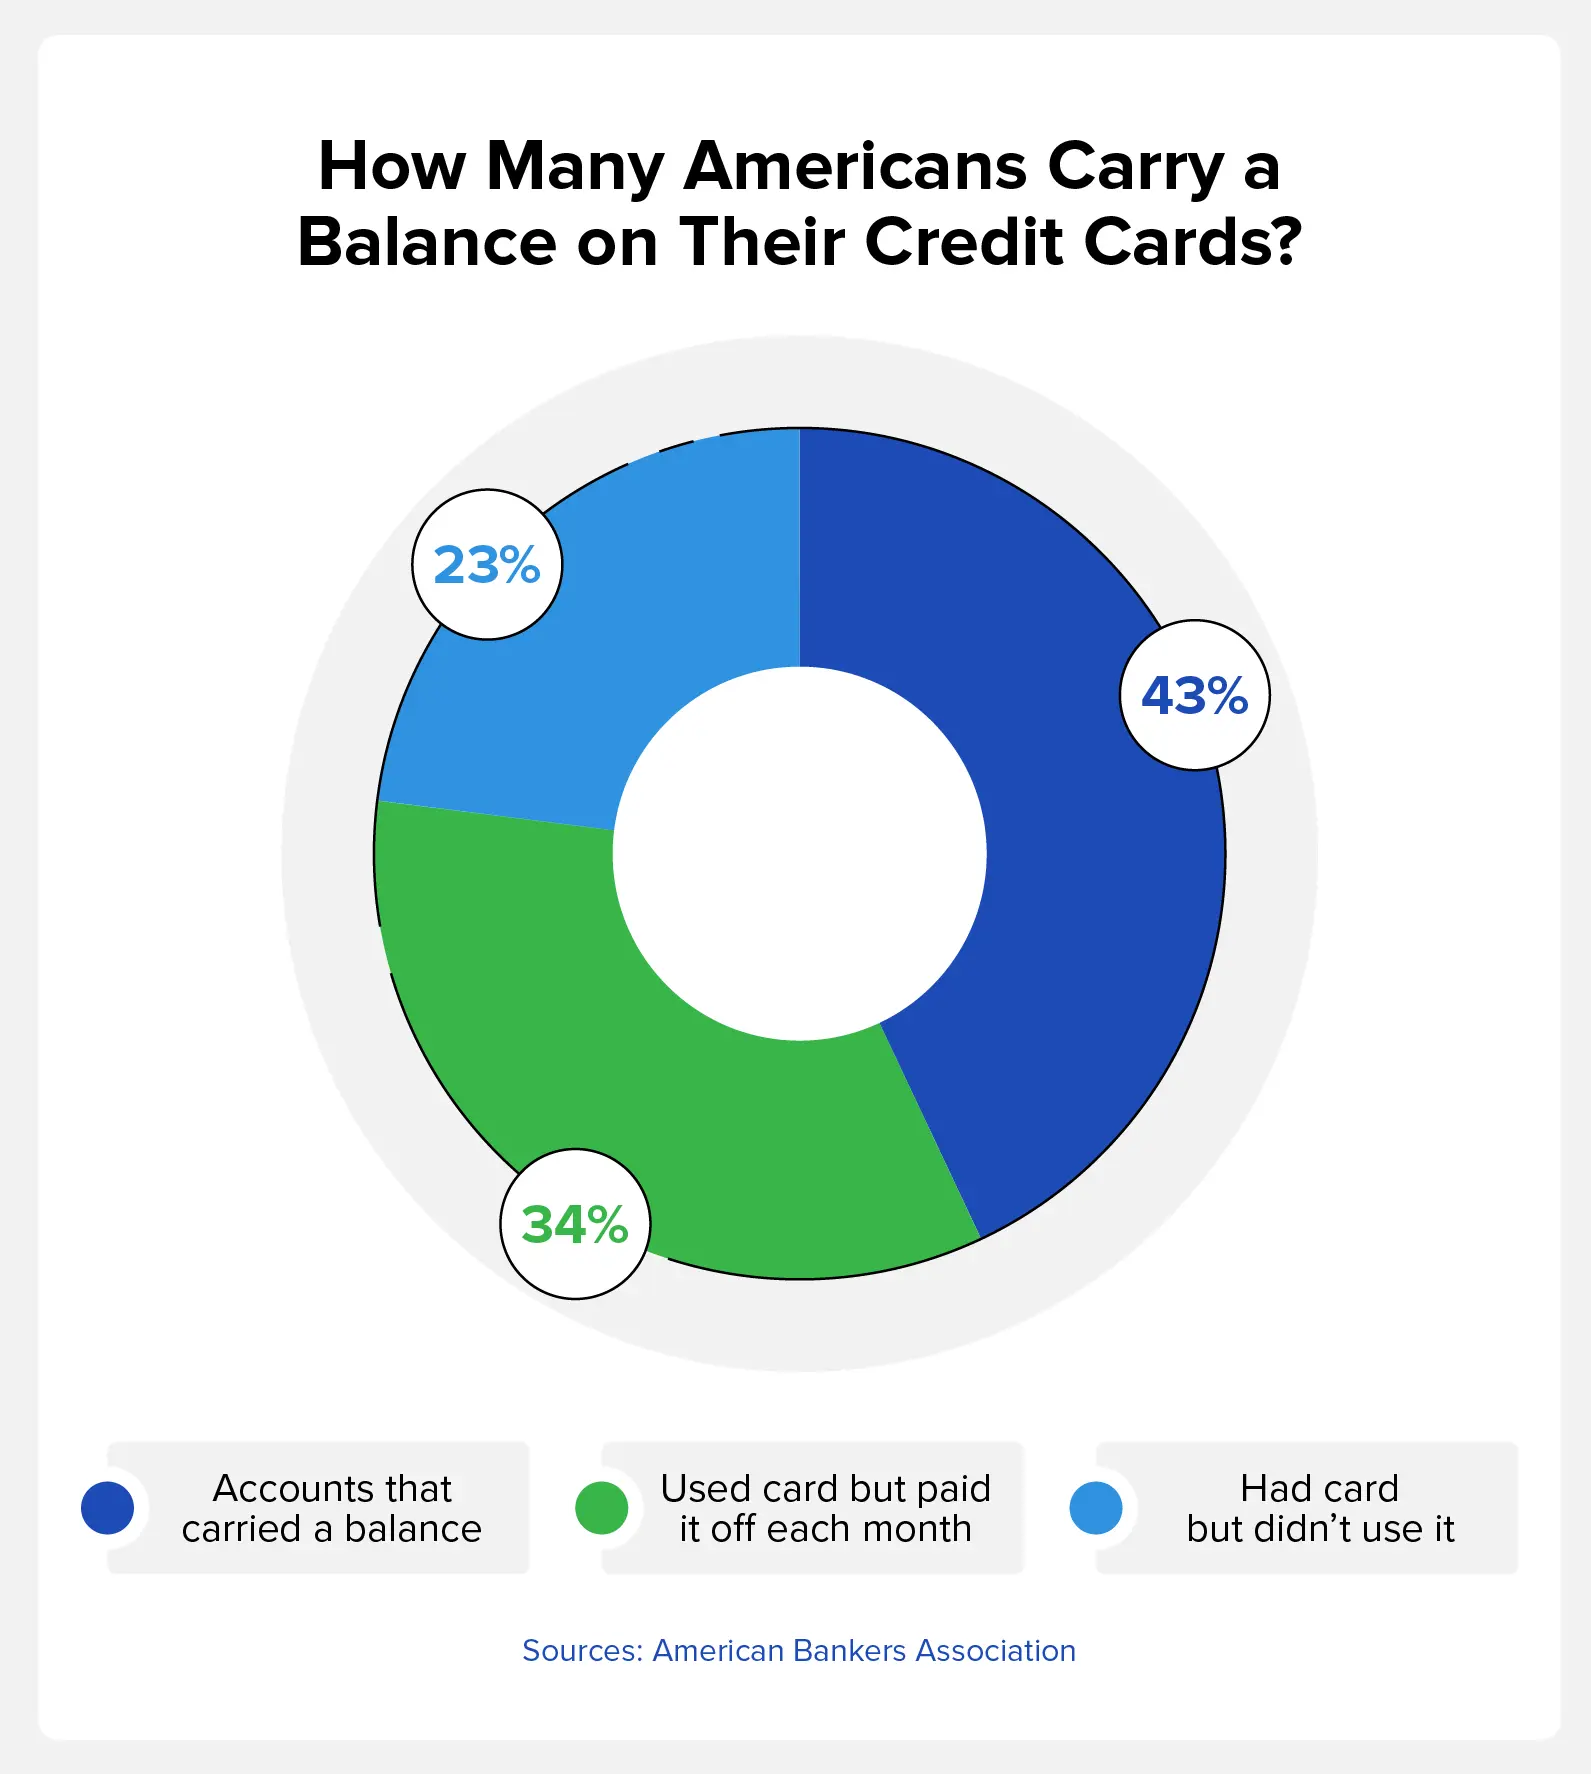
In America, approximately 43% of credit cards carried a balance, 23% were dormant, and 34% were used but paid off each month. Those who pay off their credit card balance are able to keep a low credit utilization ratio and prevent the accumulation of debt.
Tip: Use our credit card payoff calculator to estimate when you’ll be debt free.

Average Interest Rates for New Credit Card Offers
LendingTree analyzed the terms and conditions of 200 credit cards from upwards of 50 different credit card companies, banks, and credit unions. With this data, they were able to gather an assortment of information involving annual percentage rates (APR).
The APR is the amount of interest consumers pay for their purchases, and the following table is broken down by credit card type.
The following table is based on data from July 2023.
|
Credit card type |
Minimum APR |
Maximum APR |
Average |
Previous month |
|---|---|---|---|---|
|
Average APR for all new card offers |
20.79% |
27.70% |
24.24% |
24.06% |
|
0% balance transfer cards |
18.48% |
27.50% |
22.99% |
23.04% |
|
No-annual-fee cards |
20.24% |
27.36% |
23.80% |
23.59% |
|
Rewards cards |
20.57% |
27.82% |
24.19% |
24.07% |
|
Cashback cards |
20.67% |
27.40% |
24.04% |
23.80% |
|
Travel rewards cards |
20.66% |
28.55% |
24.61% |
24.53% |
|
Airline credit cards |
20.96% |
29.14% |
25.05% |
25.05% |
|
Hotel credit cards |
21.43% |
29.25% |
25.34% |
25.21% |
|
Low-interest credit cards |
13.82% |
22.39% |
18.11% |
18.60% |
|
Grocery rewards cards |
20.31% |
27.93% |
24.12% |
24.18% |
|
Gas rewards cards |
20.72% |
27.74% |
24.23% |
24.28% |
|
Dining rewards cards |
20.45% |
28.23% |
24.34% |
24.26% |
|
Student credit cards |
19.38% |
27.67% |
23.53% |
23.02% |
|
Secured credit cards |
26.86% |
26.86% |
26.86% |
25.83% |
Average Credit Card Debt by State
In February 2023, Credit Karma gathered data from 74 million of their members to see which states had the most and least amount of credit card debt. Below, we’ve compiled a complete list based on Credit Karma’s data that contains the average credit card debt for each of the 50 states alphabetically.
|
State |
Average credit card debt |
|
|---|---|---|
|
Alabama |
$5,647 |
|
|
Alaska |
$8,139 |
|
|
Arizona |
$6,198 |
|
|
Arkansas |
$5,600 |
|
|
California |
$6,952 |
|
|
Colorado |
$6,710 |
|
|
Connecticut |
$7,032 |
|
|
Delaware |
$6,429 |
|
|
Florida |
$6,783 |
|
|
Georgia |
$6,563 |
|
|
Hawaii |
$7,444 |
|
|
Idaho |
$5,737 |
|
|
Illinois |
$6,615 |
|
|
Indiana |
$5,601 |
|
|
Iowa |
$5,732 |
|
|
Kansas |
$6,122 |
|
|
Kentucky |
$5,455 |
|
|
Louisiana |
$5,872 |
|
|
Maine |
$5,788 |
|
|
Maryland |
$7,248 |
|
|
Massachusetts |
$6,700 |
|
|
Michigan |
$5,812 |
|
|
Minnesota |
$6,166 |
|
|
Mississippi |
$5,259 |
|
|
Missouri |
$5,869 |
|
|
Montana |
$6,026 |
|
|
Nebraska |
$6,188 |
|
|
Nevada |
$6,548 |
|
|
New Hampshire |
$6,545 |
|
|
New Jersey |
$7,306 |
|
|
New Mexico |
$5,871 |
|
|
New York |
$7,029 |
|
|
North Carolina |
$5,969 |
|
|
North Dakota |
$6,347 |
|
|
Ohio |
$5,879 |
|
|
Oklahoma |
$6,030 |
|
|
Oregon |
$6,113 |
|
|
Pennsylvania |
$6,180 |
|
|
Rhode Island |
$6,498 |
|
|
South Carolina |
$5,989 |
|
|
South Dakota |
$5,987 |
|
|
Tennessee |
$5,832 |
|
|
Texas |
$6,707 |
|
|
Utah |
$6,040 |
|
|
Vermont |
$5,945 |
|
|
Virginia |
$7,174 |
|
|
Washington |
$6,869 |
|
|
West Virginia |
$5,674 |
|
|
Wisconsin |
$5,593 |
|
|
Wyoming |
$6,383 |
Top 10 States With the Most Credit Card Debt
The following states had the most credit card debt, with Alaska having the highest average credit card debt in America at $8,139 per person.
|
|
State |
Average credit card debt |
|---|---|---|
|
1. |
Alaska |
$8,139 |
|
2. |
Hawaii |
$7,444 |
|
3. |
New Jersey |
$7,306 |
|
4. |
Maryland |
$7,248 |
|
5. |
Virginia |
$7,174 |
|
6. |
Connecticut |
$7,032 |
|
7. |
New York |
$7,029 |
|
8. |
California |
$6,952 |
|
9. |
Washington |
$6,869 |
|
10. |
Florida |
$6,783 |

Top 10 States With the Least Credit Card Debt
The major credit bureau, Experian, tracks credit card debt data as well and found that between 2021 and 2022, overall credit card debt in the U.S. increased from $785 billion to $910 billion—a 16% increase. The average debt also increased in many states, according to Credit Karma’s report.
|
|
State |
Average credit card debt |
|---|---|---|
|
1. |
Mississippi |
$5,259 |
|
2. |
Kentucky |
$5,455 |
|
3. |
Wisconsin |
$5,593 |
|
4. |
Arkansas |
$5,600 |
|
5. |
Indiana |
$5,601 |
|
6. |
Alabama |
$5,647 |
|
7. |
West Virginia |
$5,674 |
|
8. |
Iowa |
$5,732 |
|
9. |
Idaho |
$5,737 |
|
10. |
Maine |
$5,788 |
Average Credit Card Debt by Age
Credit Karma’s report with the state-by-state data also broke down credit card debt by age group. Currently, Generation X carries the most credit card debt, while Generation Z carries the least.
|
Age group |
Average credit card debt |
|---|---|
|
11-26 (Generation Z) |
$2,781 |
|
27-42 (Millennials) |
$5,898
|
|
41-58 (Generation X) |
$8,266 |
|
59-77 (Baby Boomers) |
$7,464 |
|
78-95 (Silent Generation) |
$5,649 |
Average Credit Card Debt by Income
The following data comes from the Federal Reserve’s Survey of Consumer Finances (SCF) and was most recently updated in 2019. The Federal Reserve completed a new survey at the end of 2022 and will have updated data later in 2023.
As you’ll see, higher-income individuals have much more credit card debt than those who make less. This makes sense because high-income individuals are able to get much larger credit lines. But when you look at the debt-to-income ratio, lower-income households have much more consumer debt compared to the amount of money they make.
|
Percentile of Income |
Average credit card debt |
|---|---|
|
Less than 20% |
$3,800 |
|
20%-39% |
$4,700
|
|
40%-59% |
$4,900 |
|
60%-79% |
$7,000 |
|
80%-89% |
$9,800 |
|
90%-100% |
$12,600 |
Average Household Credit Card Debt
A recent study from WalletHub found that while total credit card debt in the United States rose 14.1% between 2022 and 2023, household credit card debt only rose by 8.39%.
Their data shows that the average household credit card debt at the end of the first quarter in 2023 was $9,654 adjusted for inflation, which is $738 higher than the same time the previous year. WalletHub’s chart goes back to 1986, and the highest household credit card debt was in 2007 when it was $12,221 on average per household.
Average Credit Card Debt by Race or Ethnicity
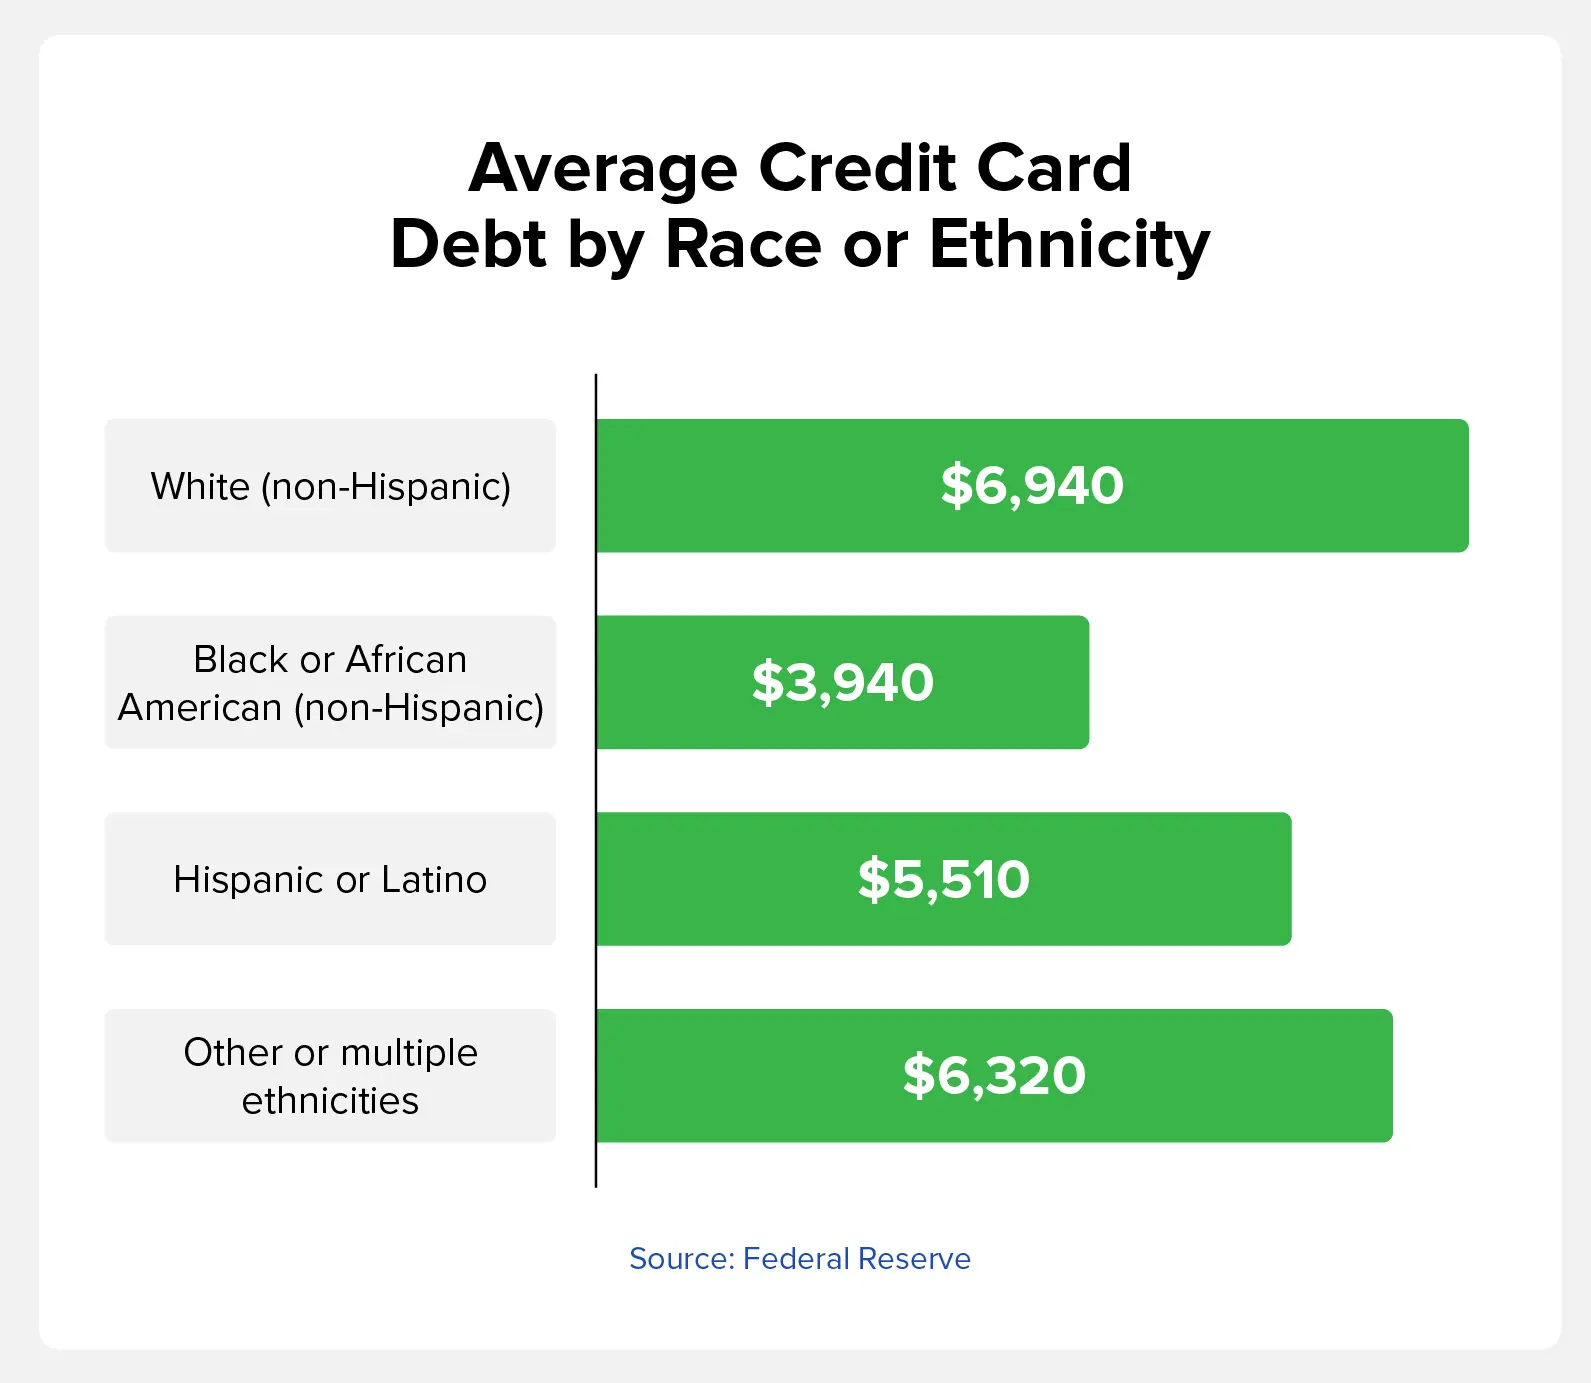
Research from Annuity.org shows that Black and Hispanic Americans are less likely to feel financially stable and less likely to have a bank account. This information can help us better understand what’s happening in the financial lives of different communities.
This data comes from the Federal Reserve’s 2019 SCF.
|
Race |
Average credit card debt |
|---|---|
|
White (non-Hispanic) |
$6,940 |
|
Black or African American (non-Hispanic) |
$3,940
|
|
Hispanic or Latino |
$5,510 |
|
Other or multiple races |
$6,320 |

Credit Card Delinquency Rates in America
When someone is at least 30 days past due on their credit card payment, their status becomes delinquent. The number of delinquencies in the United States can be a measure of people’s ability to pay down their credit card debt.
To track this data, Experian conducted a study between 2021 and 2022:
- Accounts 30 to 59 days past due increased from 1.04% of total accounts to 1.67%.
- The delinquency rate of accounts 60 to 89 days past due increased to 1.01%.
- Accounts 90 to 180 days past due rose to 0.63%.
How to Get Out of Credit Card Debt and Improve Your Credit
Credit card debt in America is something many individuals struggle with, and when your debt isn’t under control, it can affect your credit. A lower credit score leads to higher interest rates, which means you’re paying more for your purchases. It can also lead to being denied new credit lines.
Here are some simple steps you can take to start getting out of debt sooner rather than later:
- Reduce additional credit card spending: You don’t want to add to your current debt if you don’t have to.
- Create a budget: Cutting your spending can help you save additional funds to pay down your debt.
- Use the snowball method: Each month, pay off your smallest debt in full. This can help you build momentum as you chip away at your overall debt.
- Try debt consolidation: Consolidating your debt may help reduce the interest rate and keep your debt in one place rather than with different creditors.
- Get a balance transfer card: Balance transfer cards allow you to transfer credit card debt to a different account, which may have a lower interest rate and will also help you consolidate your debt.
If you need help getting your debt under control and improving your credit, Credit.com has resources to help you learn to better manage your finances. To begin managing your credit, sign up for a free credit report card and check out ExtraCredit®. Our services can help you learn how to work on your credit and educate you about managing your finances so you know how to work toward the life you want.

Methodology for Credit.com data: This survey was conducted for Credit.com using Suzy. The sample consisted of a total of 1,154 responses per question and is statistically representative of the general population. This survey was conducted in December 2022.
You Might Also Like
April 9, 2024
Credit Cards
October 21, 2020
Credit Cards
August 3, 2020
Credit Cards


